
A unique mathematical formula, which models the bitcoin price precisely for more than 10 years before and more than 10 years after today. Believe it or not, but there is a simple formula to calculate the future bitcoin price with great accuracy.
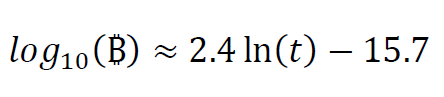
Want to know the price for Bitcoin — take your scientific calculator and calculate it:


Where t — the number of days since the Bitcoin Genesis block.
Dear friends, colleagues, clients and enthusiasts!
By this article I want to congratulate everyone of you on this CRYPTO blog coming.
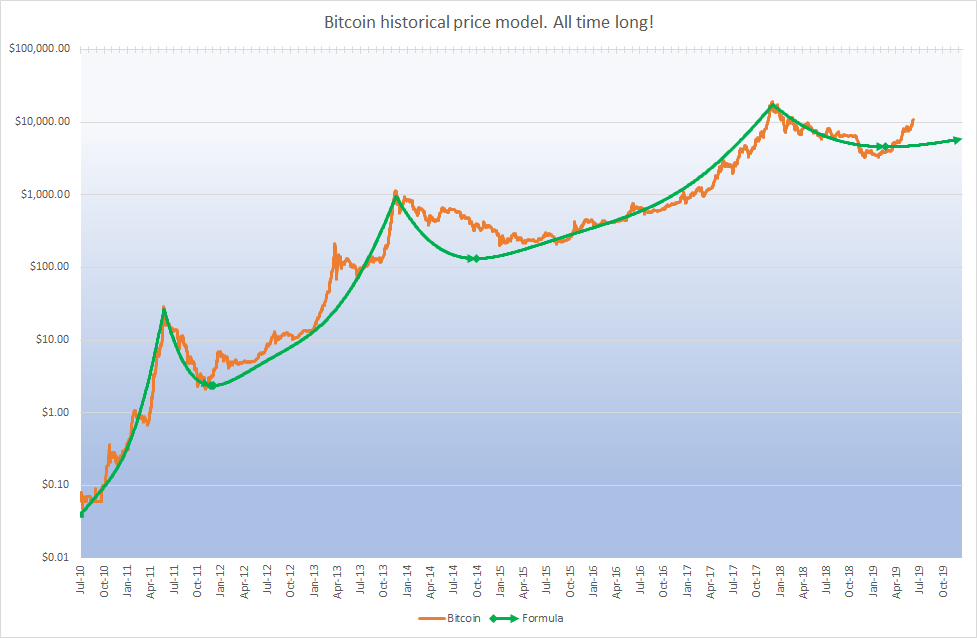
I know that all of you saw this diagram millions of times in your bitcoin journey. What is the orange line in this chart? Of course many people will easily recognize the BTC-USD price chart.
But let me add to this diagram some mathematics the way that probably nobody did with this chart.
I took all available data since July 2010. The bitcoin price was 5 cents per one BTC! Yes, you could easily buy 20 BTC per one dollar in July 2010!!! All you had to do was to find some of the few smart guys who called themselves “bitcoin miners” and offer them some “real money” in exchange for their strange “fake money” — Bitcoin. They needed this money to buy equipment and to develop the blockchain further. I wish I were that smart then!
Anyways, let me go straight to the simple formula for this blue trend-line on the chart above:
Bitcoin long term trend-line formula (the two forms are equivalent to each other):


₿ — BTC to USD exchange rate
t — the number of days since January 3, 2009 (the Bitcoin Genesis block date)
All formulas represent the same curve and just written differently. The first form explains the logarithmic shape of the trend-line curve, while the other two are easier to use for computations. You may use whichever form is more convenient.
Here is the chart with the trend-line plotted:


This is by itself a very powerful formula indeed! You may now model the price trend for years ahead!
Just as an example. For July 1, 2019 the trend value for bitcoin would be… Please use your scientific calculator to check it out:


3831 days is the time distance from the bitcoin genesis block till July 1, 2019 (that is about 10.5 years). We are exactly at this level now!
Another example. For July 1, 2022 the approximate value for bitcoin, based on the trend model, would be…:


The next step would be to model analytically the waves in observations. Of coarse the waves have strong fundamentals due to halving changes. However for this analysis I will only focus on the shape of the curve and will model it by some nonlinear functions. After a few sleepless nights I came up with this “one line” analytical model:


Isn’t it beautiful? I know, some would shout at me “such a crap…” And you might be right this formula may look scary. However, this would be a fun mathematical exercise for some of my math students whom I used to train for the International Mathematical Olympiad (https://www.imo-official.org/). I do believe that teaching this formula in high schools would increase the interest for learning the blockchain and its implementations to the new crypto economy and will definitely help students understand the crypto world much faster.
Now let’s see how this model fits the actual historic data!

Many researchers drew a line like this one “by hand”. Many used the fractal structure to model the next wave. In my research I fully agree with this approach since there is no signs that the past does not model the future in this case. In terms of the shape I do not think this shape will be a surprise for most of you. I just want to add a touch of math to this expectations and make it easier to explain our friends why we do believe in bitcoin and that it will soon hit 100K in a matter of 1 or 2 years.
By the way — do you want to see what the model predicts for the next couple of years?
I bet you do! So, let’s run the model. Please note that this chart is in linear scale, that is why the trend line is concave upward. That is that long term “parabolic trend”:


Here, how the model looks in 2 year time frame at time of writing (July 27, 2019) when BTC just reached and tries to overcome its long term trend at 12.6K. The blue line is the all time trend. The green line — is the wave model. Bitcoin has just jumped from the green line to the blue line. Both lines are predicted by the formulas in this article. Such a spectacular drama isn’t it? Let’s see what may happen next.
The next 7 years predictions for the bitcoin price:

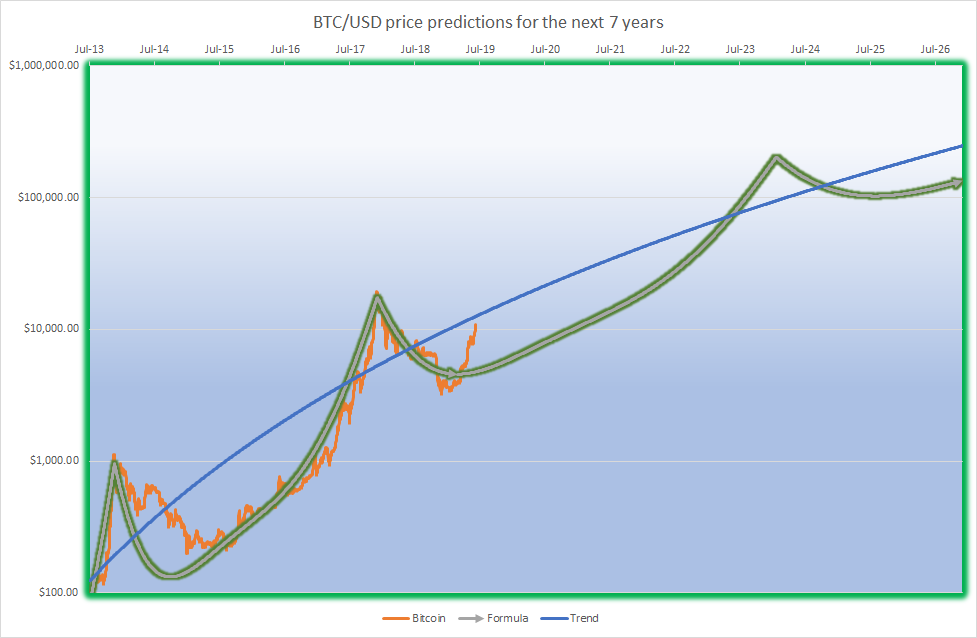
As you may see the model predicts the BTC price to hit 100K somewhere between year 21–23.
And the disclaimer:
The model presented in this article is just for educational purposes. You should not make your investment decisions based on this model — use your own judgement responsibly and enjoy the math!
Solomon Salau
Crypto consultant, Crypto Trading expert, adviser, investor, mathematician, educator, crypto enthusiast.
Comments